Logs in Explore
Along with metrics, Explore allows you to investigate your logs.
During an infrastructure monitoring and incident response, you can dig deeper into the metrics and logs to find the cause. Explore also allows you to correlate metrics and logs by viewing them side-by-side. This creates anew debugging workflow:
- Receive an alert.
- Drill down and examine metrics.
- Drill down again and search logs related to the metric and time interval (and in the future, distributed traces).
Logs visualization
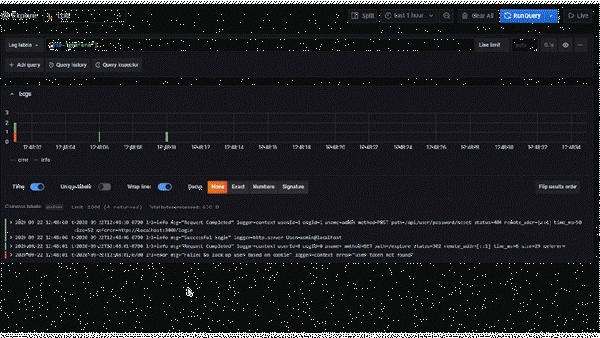
Results of log queries are shown as histograms in the graph and individual logs are explained in the following sections.
FojiSoft supports a full range log volume histogram, the graph with log distribution for all entered log queries is shown automatically.
Log level
For logs where a level label is specified, we use the value of the label to determine the log level and update color accordingly. If the log doesn’t have a level label specified, we try to find out if its content matches any of the supported expressions (see below for more information). The log level is always determined by the first match. In case FojiSoft is not able to determine a log level, it will be visualized with an unknown log level.
Supported log levels and mapping of log level abbreviation and expressions:
Supported expressions Log level Color
emerg critical purple
fatal critical purple
alert critical purple
crit critical purple
critical critical purple
err error red
eror error red
error error red
warn warning yellow
warning warning yellow
info info green
information info green
notice info green
dbug debug blue
debug debug blue
trace trace light blue
* unknown grey
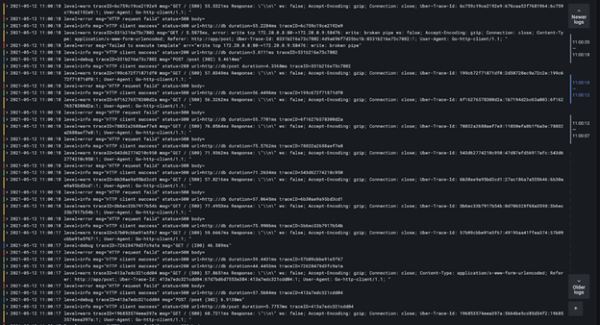
Logs navigation next to the log lines can be used to request more logs. You can do this by clicking on Older logs button on the bottom of navigation. This is especially useful when you hit the line limit and you want to see more logs. Each request that is run from the navigation is then displayed in the navigation as separate page. Every page is showing from and to timestamp of the incoming log lines. You can see previous results by clicking on the page. Explore is caching last five requests run from the logs navigation, so you are not re-running the same queries when clicking on the pages.

Visualization options
You can customize how logs are displayed and select which columns are shown.
Time
Shows or hides the time column. This is the timestamp associated with the log line as reported from the data source.
Unique labels
Shows or hides the unique labels column that includes only non-common labels. All common labels are displayed above.
Wrap lines
Set this to True if you want the display to use line wrapping. If set to False, it will result in horizontal scrolling.
Prettify JSON
Set this to true to pretty print all JSON logs. This setting does not affect logs in any format other than JSON.
Deduping
Log data can be very repetitive and Explore can help by hiding duplicate log lines. There are a few different deduplication algorithms that you can use:
- Exact - Exact matches are done on the whole line except for date fields.
- Numbers - Matches on the line after stripping out numbers such as durations, IP addresses, and so on.
- Signature - The most aggressive deduping, this strips all letters and numbers and matches on the remaining whitespace and punctuation.
Flip results order
You can change the order of received logs from the default descending order (newest first) to ascending order (oldest first).
Labels and detected fields
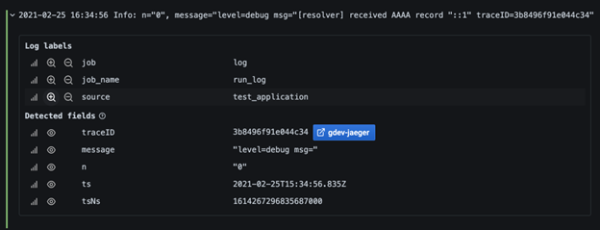
Each log row has an extendable area with its labels and detected fields, for more robust interaction. For all labels we have added the ability to filter for (positive filter) and filter out (negative filter) selected labels. Each field or labe lalso has a stats icon to display ad-hoc statistics in relation to all displayed logs.
Escaping newlines
Explore automatically detects some incorrectly escaped sequences in log lines, such as new lines (\n, \r) or tabs (\t). When it detects such sequences, Explore provides an “Escape newlines” option.
To automatically fix incorrectly escaped sequences that Explore has detected:
- Click “Escape newlines” to replace the sequences.
- Manually review the replacements to confirm their correctness.
Explore replaces these sequences. When it does so, the option will change from “Escape new lines” to “Remove escaping”. Evaluate the changes as the parsing may not be accurate based on the input received. You can revert the replacements by clicking “Remove escaping”.
Derived fields links
By using Derived fields, you can turn any part of a log message into an internal or external link. The created link is visible as a button next to the Detected field in the Log details view.

Toggle detected fields
Expand a log line and then click the eye icon to show or hide fields.

Specific features
FojiSoft does not index the contents of the logs, but rather a set of labels for each log stream. The logs from Foji are queried in a similar way to querying with label selectors in metrics. It uses labels to group log streams which can be made to match up with your metric labels.
Switch from metrics to logs
If you switch from a metric query to a logs query (you can do a split first to have your metrics and logs side by side) then it will keep the labels from your query that exist in the logs and use those to query the log streams.
This will return a chunk of logs in the selected time range that can be grepped/textsearched.
Live tailing
Use the Live tailing feature to see real-time logs on supported data sources.
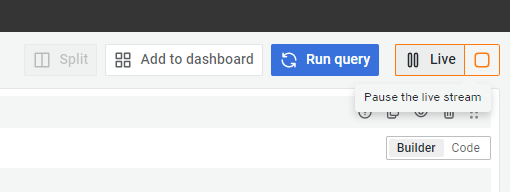
Click the Live button in the Explore toolbar to switch to Live tail view.

While in Live tail view new logs will come from the bottom of the screen and will have fading contrasting background so you can keep track of what is new. Click the Pause button or scroll the logs view to pause the Live tailing and explore previous logs without interruption. Click Resume button to resume the Live tailing or click Stop button to exit Live tailing and go back to standard Explore view.